Statistical Inference with R
Inference for Categorical Data
Chi-square tests, proportions, and contingency tables in R
Dan Kerchner · George Washington University Libraries & Academic Innovation · Fall 2026
Upcoming R Workshops (Fall 2026) 🗓️
- Sept. 29 (Tues.), 12:30-2:30pm | Statistical Inference with R: Linear & Logistic Regression Modeling
- Oct. 1 (Thurs.), 1pm-3:30pm | Farther into R: More R for Data Analysis
There will be more in the Spring!
📅 Find all GW Libraries workshops and events at library.gwu.edu/events
What are we actually doing?
Categorical Data Analaysis
Categorical variables
- binary/dichotomous - 2 levels
- 3+ levels - nominal or ordinal
Categorical data analysis
- Response is categorical
- Predictors may be numerical and/or categorical
Representations of Categorical Data
- Individual observations
| ID | Smoking history |
|---|---|
| P001 | Prev/Curr |
| P002 | Never |
| … | … |
| P184 | Never |
- Summary-level:
- Number of times (frequency) that a category/level is observed
- Proportion/relative frequency of a level being observed
- Number of times (frequency) that a category/level is observed
| Smoking history | n | % |
|---|---|---|
| Prev/Curr Smoker | 1,915 | 44.2% |
| Never | 1,740 | 40.1% |
| Unknown | 680 | 15.7% |
| NA | 1 | < 0.1 % |
Proportions
Population
A, B, AB, O, O, B, A, B, AB, O, B, A, O, AB, O, O, B, A, B, AB, O, O, B, A, B, AB, O, B, A, O, AB, O, O,B, A, B, AB, O, O, B, A, B, AB, O, B, A, O, AB, O, O, B, A, B, AB, O, O, B, A, B, AB, O, …
Sample
A, AB, O, O, B, B, O, A, O, O
Sample Proportions
| A | 2 (20%) |
| B | 2 (20%) |
| AB | 1 (10%) |
| O | 5 (50%) |
Questions we may want to ask:
- What do we estimate the proportions in the population to be?
- Do the sample proportions support a particular assertion about the proportions in the population?
Categorical Predictor, (Binary) Categoical Response
| Hospital | Outcome |
|---|---|
| GW | 1 |
| Georgetown | 0 |
| Sibley | 1 |
| Georgetown | 1 |
| Sibley | 1 |
| GW | 0 |
| GW | 1 |
| Sibley | 0 |
| Georgetown | 1 |
| GW | 0 |
| Sibley | 1 |
| GW | 1 |
| Georgetown | 0 |
| Sibley | 1 |
| GW | 0 |
| Georgetown | 0 |
| GW | 1 |
| Outcome = 0 | Outcome = 1 | |
|---|---|---|
| GW | 3 | 4 |
| Georgetown | 3 | 2 |
| Sibley | 1 | 4 |
Questions we may want to ask:
- Is Outcome associated with Hospital?
- How do the odds of a certain outcome compare at one hospital vs. another?
Measures of association between 2 binary variables
| Diseased | Healthy | |
| Exposed | \(D_E\) | \(H_E\) |
| Not exposed | \(D_N\) | \(H_N\) |
| Odds Ratio (OR) | \(\frac{D_E / H_E}{D_N / H_N}\) |
| Risk Ratio (RR) | \(\frac{D_E / (D_E + H_E)}{D_N / (D_N + H_N)}\) |
| Risk Difference (RD) | \(\frac{D_E}{(D_E + H_E)} - \frac{D_N}{(D_N + H_N)}\) |
Two forms of inference
CONFIDENCE INTERVAL
A range of plausible values for the parameter
\(95\%\text{ CI for }\pi = (0.44,\ 0.49)\)
(estimation)
HYPOTHESIS TEST
A verdict on one specific claim about the parameter
\(H_0: \pi = \pi_0\) null hypothesis
\(H_A: \pi \neq \pi_0\) alternative hypothesis
(decision — \(H_0\) or \(H_A\))
- \(p\)-value
- If \(H_0\) were true, the chance of getting a result at least as extreme as ours. Not the chance that \(H_0\) is true.
- \(\alpha\)
- Significance level — our tolerance for rejecting \(H_0\) when we should not. Reject \(H_0\) when \(p < \alpha\).
Two views of the same thing: the 95% CI is exactly the set of \(\mu_0\) we would not reject at \(\alpha = 0.05\).
Inference with categorical data
Test of Proportions
\(H_0: \pi = \pi_0\) null hypothesis
\(H_A: \pi \neq \pi_0\) alternative hypothesis
Inference with Odds Ratios, Risk Ratios, Risk Differences
\(H_0: OR = 1 \Leftrightarrow RR = 1 \Leftrightarrow RD = 0\) null hypothesis
\(H_A: OR \neq 1 \Leftrightarrow RR \neq 1 \Leftrightarrow RD \neq 0\) alternative hypothesis
Prerequisites / Assumptions
For proportion test, \(\chi^2\) (“chi-squared”) test, OR/RR/RD:
- observations are independent
- \(n \geq 5\) in each group* (observed for hyp. test; expected for CI)
- proportion of interest is not too close to 0 or 1
When the assumptions are not satisfied, we may use other approaches (nonparametric tests, bootstrapping, etc.)
Today: 3 Scenarios
- Binomial variable: Single population proportion
- Multinomial variables / proportions
- Association between bionomial predictor and binomial response (outcome)
Today’s Data Set #1
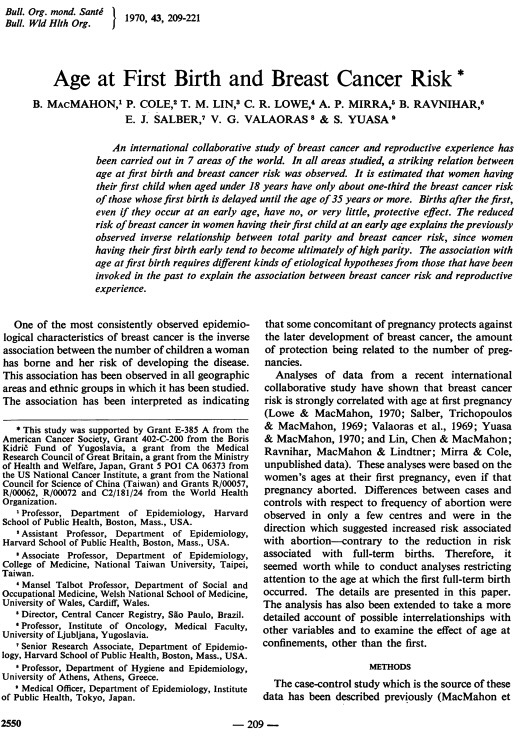
MacMahon B, Cole P, Lin TM, Lowe CR, Mirra AP, Ravnihar B, Salber EJ, Valaoras VG, Yuasa S. Age at first birth and breast cancer risk. Bull World Health Organ. 1970;43(2):209-21. PMID: 5312521; PMCID: PMC2427645.
Today’s Data Set #2
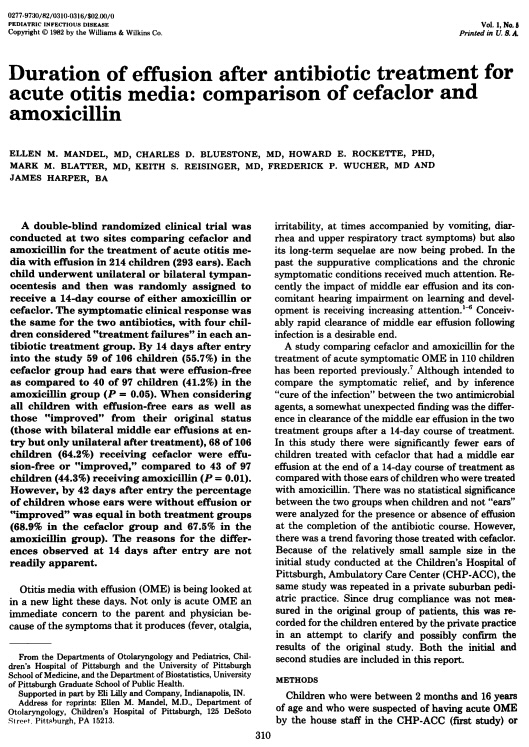
Mandel EM, Bluestone CD, Rockette HE, Blatter MM, Reisinger KS, Wucher FP, Harper J. Duration of effusion after antibiotic treatment for acute otitis media: comparison of cefaclor and amoxicillin. Pediatr Infect Dis. 1982 Sep-Oct;1(5):310-6. doi: 10.1097/00006454-198209000-00006. PMID: 6760146.
Thanks! 🎶 🙏
Dan Kerchner | George Washington University Libraries
kerchner@gwu.edu
Stats & Coding help @ GW:
| me | R, Python, etc. | calendly.com/kerchner |
| Academic Commons Data Consultants | R, Statistics, Python, SAS, Excel, etc. | go.gwu.edu/DataConsulting |
| LAI Software developers | Python, web apps, HTML, etc. | calendly.com/gwul-coding |
These slides: kerchner.github.io/r4stats/categorical
Code: github.com/kerchner/r4stats in the categorical/R folder
R LibGuide: libguides.gwu.edu/r_stats
Statistical Inference with R · GW Libraries & Academic Innovation · kerchner.github.io/r4stats