Statistical Inference with R
Inference for Continuous Data
t-tests, ANOVA, and confidence intervals for comparing means
Dan Kerchner · George Washington University Libraries & Academic Innovation · Fall 2026
Upcoming R Workshops (Fall 2026) 🗓️
- Sept. 22 (Tues.), 12:30-2:30pm | Statistical Inference with R: Inference for Categorical Data
- Sept. 29 (Tues.), 12:30-2:30pm | Statistical Inference with R: Linear & Logistic Regression Modeling
- Oct. 1 (Thurs.), 1pm-3:30pm | Farther into R: More R for Data Analysis
There will be more in the Spring!
📅 Find all GW Libraries workshops and events at library.gwu.edu/events
What are we actually doing?
Two forms of inference
CONFIDENCE INTERVAL
A range of plausible values for the parameter
\(95\%\text{ CI for }\mu = (67.2,\ 73.5)\)
(estimation)
HYPOTHESIS TEST
A verdict on one specific claim about the parameter
\(H_0: \mu = \mu_0\) null hypothesis — or like \(\mu \leq \mu_0\), or \(\mu \geq \mu_0\)
\(H_A: \mu \neq \mu_0\) alternative — or like \(\mu > \mu_0\), or \(\mu < \mu_0\) (respectively)
(decision — \(H_0\) or \(H_A\))
- \(p\)-value
- If \(H_0\) were true, the chance of getting a result at least as extreme as ours. Not the chance that \(H_0\) is true.
- \(\alpha\)
- Significance level — our tolerance for rejecting \(H_0\) when we should not. Reject \(H_0\) when \(p < \alpha\).
Two views of the same thing: the 95% CI is exactly the set of \(\mu_0\) we would not reject at \(\alpha = 0.05\).
Quick refresher: t-tests and ANOVA
1-sample \(t\)-test \(H_0: \mu = \mu_0\)
If the true mean were \(\mu_0\), how often would we see a sample mean at least this far from \(\mu_0\)?
2-sample \(t\)-test \(H_0: \mu_1 = \mu_2\)
If the two groups had the same mean, how often would we see a difference in sample means at least this large?
ANOVA \(H_0: \mu_1 = \mu_2 = \cdots = \mu_k\)
If all \(k\) groups had the same mean, how often would we see the group means spread at least this far apart?
Same question every time: assume nothing is going on, then ask how surprising our data would be.
Paired vs. unpaired data
UNPAIRED
Two independent groups. Nothing links a particular dot on the left to a particular dot on the right.
2-sample \(t\)-test — \(H_0: \mu_1 = \mu_2\)
PAIRED
Each subject is measured twice. Every line is one subject, so each dot has exactly one partner.
1-sample \(t\)-test on the differences \(d\) — \(H_0: \mu_d = 0\)
Same dots on both sides — the lines are the only difference, and they are extra information. The two clouds overlap heavily, yet every subject went up: the paired test sees that, the unpaired test cannot. Pair only when the pairing is real.
One-tailed vs. two-tailed
TWO-TAILED start here
\(H_0: \mu_A = \mu_B\) \(H_A: \mu_A \neq \mu_B\)
that is, \(\mu_A > \mu_B\) or \(\mu_A < \mu_B\)
\(\alpha\) is split between the tails — catches a difference in either direction.
ONE-TAILED only with a reason
\(H_0: \mu_A \leq \mu_B\) \(H_A: \mu_A > \mu_B\)
or the mirror image: \(H_0: \mu_A \geq \mu_B\) \(H_A: \mu_A < \mu_B\) — pick one
All of \(\alpha\) sits in one tail — more power that way, none at all the other way.
Choose the tail from the science, before you see the data. Picking it afterwards because that is where the difference landed makes a “5%” test really a 10% one. And if the effect turns up in the other tail, a one-tailed test cannot report it — however large it is. When in doubt, two-tailed: it is what t.test() does by default, and what most readers assume.
What the t-test and ANOVA assume
BOTH TESTS
- Independent observations — within each group and across groups
- Normality — either the values within each group are roughly normal, or \(n\) is large enough that the sample mean is
- A continuous outcome — a mean has to mean something
2-SAMPLE \(t\)-TEST ALSO
Roughly equal variances — t.test() defaults to Welch’s approximation, which does not assume it. Check with var.test().
ANOVA ALSO
Roughly equal variances across all \(k\) groups. Check with bartlett.test() if normal, car::leveneTest() if not. Welch version: oneway.test(var.equal = FALSE).
Not satisfied? Use a nonparametric test (Wilcoxon, Kruskal-Wallis), a bootstrap or permutation test, or a transformation. Independence is non-negotiable — no alternative test rescues it. That one needs a different design or model such as a paired test, or a mixed model.
“\(n \geq 30\)” is a rule of thumb, not a requirement. With normal data the \(t\)-test is exact at any \(n\) — small samples are exactly what Gosset built it for. With badly skewed data, 30 can be nowhere near enough. You need normality or a large \(n\), not both.
Today’s goals
Learn to use R to read in data and conduct hypothesis tests for continuous measures
- Checking assumptions
- Visualizing
- Computing p-values and confidence intervals
Today: 4 Scenarios
- Single-sample t-test
- Paired t-test (same people, measured twice)
- 2-sample t-test (different people in each group)
- ANOVA (inference for means from more than 2 independent groups)
Today’s data set
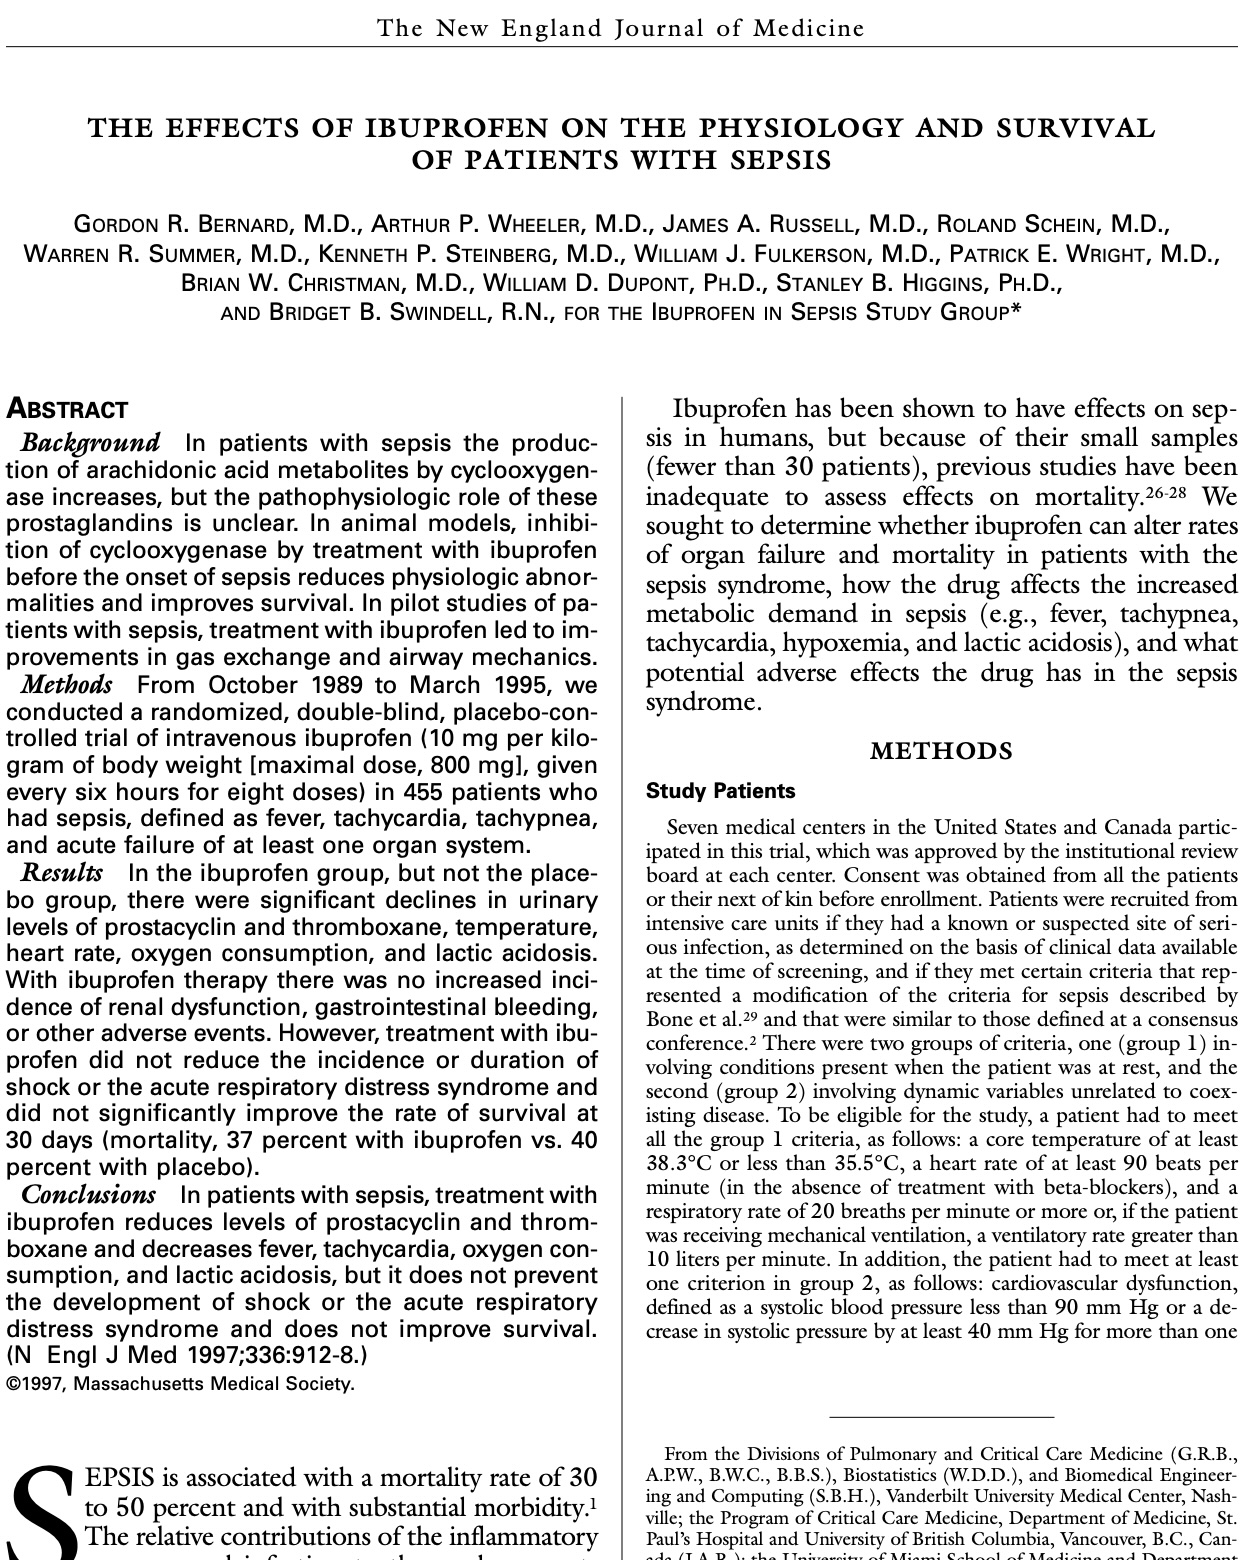
Bernard, G. R., Wheeler, A. P., Russell, J. A., Schein, R., Summer, W. R., Steinberg, K. P., Fulkerson, W. J., Wright, P. E., Christman, B. W., Dupont, W. D., Higgins, S. B., & Swindell, B. B. (1997). The effects of ibuprofen on the physiology and survival of patients with sepsis. New England Journal of Medicine, 336(13), 912–918.
Thanks! 🎶 🙏
Dan Kerchner | George Washington University Libraries
kerchner@gwu.edu
Stats & Coding help @ GW:
| me | R, Python, etc. | calendly.com/kerchner |
| Academic Commons Data Consultants | R, Statistics, Python, SAS, Excel, etc. | go.gwu.edu/DataConsulting |
| LAI Software developers | Python, web apps, HTML, etc. | calendly.com/gwul-coding |
These slides: kerchner.github.io/r4stats/continuous
Code: github.com/kerchner/r4stats in the continuous/R folder
R LibGuide: libguides.gwu.edu/r_stats
Statistical Inference with R · GW Libraries & Academic Innovation · kerchner.github.io/r4stats