Building a regression model
Overview
Teaching: 45 min
Exercises: 10 minQuestions
How can I perform a univariate regression (one x variable)?
How do I interpret the results of a regression?
How can I make a graph of my regression?
How can I look at residuals?
How would I perform a logistic regresion?
How can I build a multivariate model and perform regression?
How can I perform model selection?
How can I assess and remove outliers?
Objectives
{“TODO”=>”These need updating”}
Make a scatterplot
cor()Learn how to run regressions with
lm()andglm()Learn how to isolate parts of the matrix that
lm()returnsLearn how to run
t.test()- get p-value, CI, etc.Assess interactions between variables
We are finally ready to begin a full (multivariate) linear regression model. To do this, we are going to use information for the univariate models in the last episode.
Remove rows with NAs in any of the following variables:
library(tidyr)

analysis_swan_df <- analysis_swan_df %>% drop_na(Glucose, BMI_cat, bp_category, Age, Chol_Ratio,
                                                 RACE, log_CRP, Smoker, Exercise, age_Chol_Ratio)
full_model <- lm(Glucose ~ BMI_cat + bp_category  + Age + Chol_Ratio +
                 RACE + log_CRP + Smoker + Exercise + age_Chol_Ratio,
                 data = analysis_swan_df)
summary(full_model)
Call:
lm(formula = Glucose ~ BMI_cat + bp_category + Age + Chol_Ratio +
    RACE + log_CRP + Smoker + Exercise + age_Chol_Ratio, data = analysis_swan_df)

Residuals:
   Min     1Q Median     3Q    Max
-46.68 -10.13  -3.69   3.38 536.79

Coefficients:
                                 Estimate Std. Error t value Pr(>|t|)
(Intercept)                       94.6826    47.3161   2.001 0.045534 *
BMI_catUnderweight                -1.6994     5.0824  -0.334 0.738135
BMI_catPre-obese                   2.9901     1.7308   1.728 0.084231 .
BMI_catObesity I                   9.0305     2.1731   4.156 3.40e-05 ***
BMI_catObesity II                 10.2222     2.6504   3.857 0.000119 ***
BMI_catObesity III                16.1223     2.9688   5.431 6.37e-08 ***
bp_categoryElevated                1.0224     2.0061   0.510 0.610355
bp_categoryHypertension Stage 1    3.8376     1.6881   2.273 0.023124 *
bp_categoryHypertension Stage 2+   0.8125     2.0980   0.387 0.698588
Age                               -0.3072     0.9078  -0.338 0.735146
Chol_Ratio                        -6.8293    14.1088  -0.484 0.628412
RACEChinese                        7.2180     2.5703   2.808 0.005035 **
RACEJapanese                       7.0822     2.4412   2.901 0.003764 **
RACECaucasian                     -0.5074     1.6258  -0.312 0.755000
RACEHispanic                     -13.6399     7.0900  -1.924 0.054535 .
log_CRP                            2.3747     0.6060   3.919 9.23e-05 ***
SmokerYes                          2.3764     1.9813   1.199 0.230519
ExerciseYes                       -3.4929     1.4676  -2.380 0.017415 *
age_Chol_Ratio                     0.1815     0.2707   0.670 0.502626
---
Signif. codes:  0 '***' 0.001 '**' 0.01 '*' 0.05 '.' 0.1 ' ' 1

Residual standard error: 26.56 on 1810 degrees of freedom
Multiple R-squared:  0.09809,	Adjusted R-squared:  0.08912
F-statistic: 10.94 on 18 and 1810 DF,  p-value: < 2.2e-16
#TODO Create a stepwise selection and see what stays in the model. Based on that we will do resids etc.
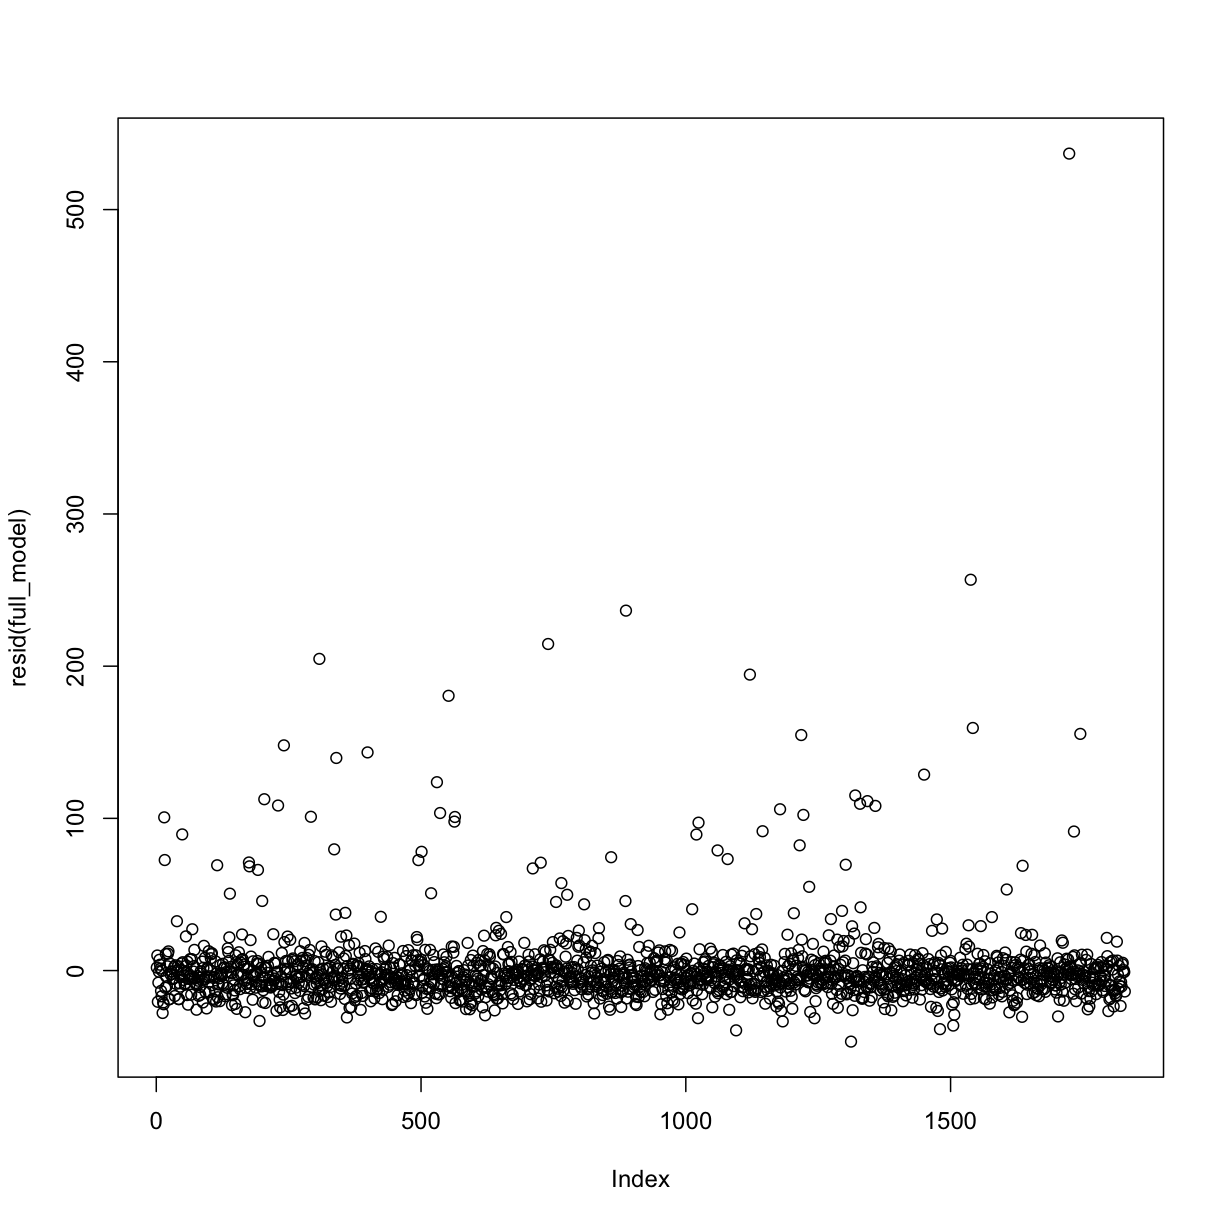
Plotting residuals
plot(resid(full_model))
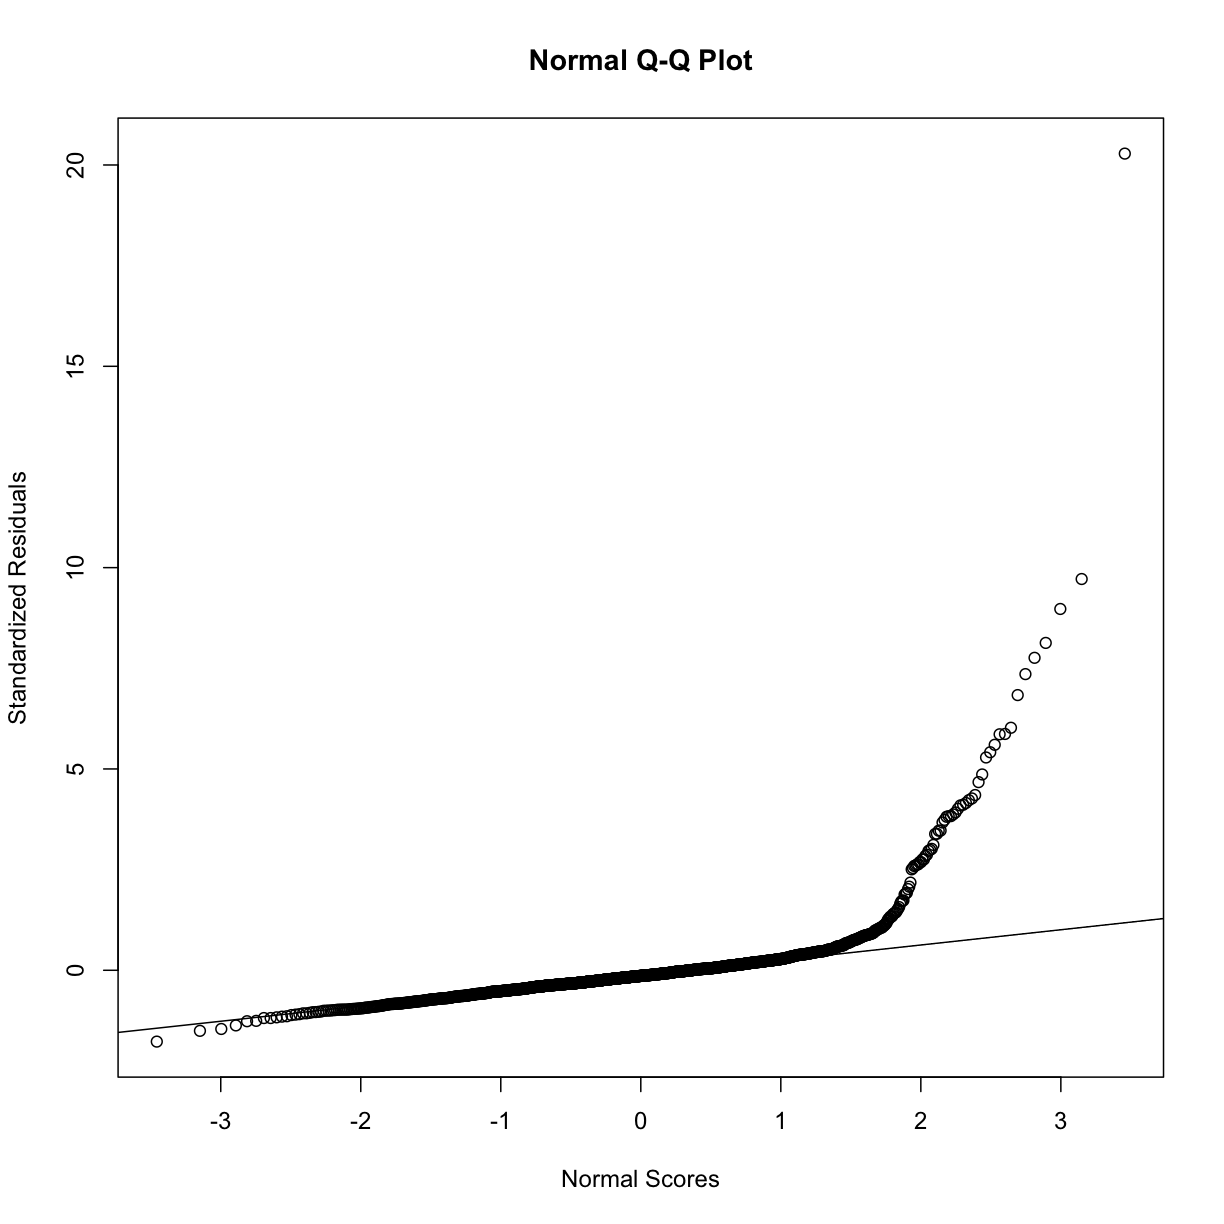
rst <- rstandard(full_model)
qqnorm(rst, ylab = "Standardized Residuals",
       xlab = "Normal Scores")
qqline(rst)
Stepwise Regression
library(MASS)
Attaching package: 'MASS'
The following object is masked from 'package:dplyr':

    select
# Stepwise regression model
step.model <- stepAIC(full_model, direction = "backward",
                      trace = TRUE )
Start:  AIC=12014.56
Glucose ~ BMI_cat + bp_category + Age + Chol_Ratio + RACE + log_CRP +
    Smoker + Exercise + age_Chol_Ratio

                 Df Sum of Sq     RSS   AIC
- Age             1      80.7 1276630 12013
- Chol_Ratio      1     165.2 1276715 12013
- age_Chol_Ratio  1     317.1 1276866 12013
- bp_category     3    3728.3 1280278 12014
- Smoker          1    1014.6 1277564 12014
<none>                        1276549 12015
- Exercise        1    3995.0 1280544 12018
- log_CRP         1   10830.7 1287380 12028
- RACE            4   17339.8 1293889 12031
- BMI_cat         5   26534.2 1303084 12042

Step:  AIC=12012.68
Glucose ~ BMI_cat + bp_category + Chol_Ratio + RACE + log_CRP +
    Smoker + Exercise + age_Chol_Ratio

                 Df Sum of Sq     RSS   AIC
- Chol_Ratio      1     249.0 1276879 12011
- bp_category     3    3675.3 1280305 12012
- Smoker          1    1035.0 1277665 12012
- age_Chol_Ratio  1    1227.9 1277858 12012
<none>                        1276630 12013
- Exercise        1    3964.4 1280594 12016
- log_CRP         1   10762.4 1287392 12026
- RACE            4   17325.7 1293956 12029
- BMI_cat         5   26600.6 1303231 12040

Step:  AIC=12011.03
Glucose ~ BMI_cat + bp_category + RACE + log_CRP + Smoker + Exercise +
    age_Chol_Ratio

                 Df Sum of Sq     RSS   AIC
- Smoker          1     956.7 1277836 12010
- bp_category     3    3780.5 1280660 12010
<none>                        1276879 12011
- Exercise        1    3983.9 1280863 12015
- age_Chol_Ratio  1    9051.4 1285931 12022
- log_CRP         1   10791.0 1287670 12024
- RACE            4   17501.3 1294380 12028
- BMI_cat         5   26398.5 1303278 12038

Step:  AIC=12010.4
Glucose ~ BMI_cat + bp_category + RACE + log_CRP + Exercise +
    age_Chol_Ratio

                 Df Sum of Sq     RSS   AIC
- bp_category     3    3838.1 1281674 12010
<none>                        1277836 12010
- Exercise        1    4810.4 1282646 12015
- age_Chol_Ratio  1    9924.0 1287760 12023
- log_CRP         1   11091.1 1288927 12024
- RACE            4   16963.1 1294799 12026
- BMI_cat         5   25527.3 1303363 12037

Step:  AIC=12009.89
Glucose ~ BMI_cat + RACE + log_CRP + Exercise + age_Chol_Ratio

                 Df Sum of Sq     RSS   AIC
<none>                        1281674 12010
- Exercise        1    4998.5 1286672 12015
- age_Chol_Ratio  1   10273.2 1291947 12022
- log_CRP         1   11364.6 1293039 12024
- RACE            4   17318.9 1298993 12026
- BMI_cat         5   28093.2 1309767 12040
summary(step.model)
Call:
lm(formula = Glucose ~ BMI_cat + RACE + log_CRP + Exercise +
    age_Chol_Ratio, data = analysis_swan_df)

Residuals:
   Min     1Q Median     3Q    Max
-45.35 -10.27  -3.82   3.29 534.99

Coefficients:
                    Estimate Std. Error t value Pr(>|t|)
(Intercept)         79.74756    2.97072  26.845  < 2e-16 ***
BMI_catUnderweight  -2.25454    5.06702  -0.445 0.656413
BMI_catPre-obese     3.33534    1.71890   1.940 0.052487 .
BMI_catObesity I     9.14490    2.15075   4.252 2.23e-05 ***
BMI_catObesity II   10.51505    2.61561   4.020 6.06e-05 ***
BMI_catObesity III  16.29875    2.91740   5.587 2.66e-08 ***
RACEChinese          6.30073    2.49851   2.522 0.011761 *
RACEJapanese         6.83868    2.40182   2.847 0.004459 **
RACECaucasian       -1.13207    1.55633  -0.727 0.467077
RACEHispanic       -13.49741    7.05809  -1.912 0.055991 .
log_CRP              2.42391    0.60405   4.013 6.24e-05 ***
ExerciseYes         -3.84610    1.44521  -2.661 0.007853 **
age_Chol_Ratio       0.05500    0.01442   3.815 0.000141 ***
---
Signif. codes:  0 '***' 0.001 '**' 0.01 '*' 0.05 '.' 0.1 ' ' 1

Residual standard error: 26.57 on 1816 degrees of freedom
Multiple R-squared:  0.09447,	Adjusted R-squared:  0.08849
F-statistic: 15.79 on 12 and 1816 DF,  p-value: < 2.2e-16
min_model <- lm(Glucose ~ BMI_cat,
                data = analysis_swan_df)

step.model <- stepAIC(min_model, direction = "forward",
                      scope = list(lower = min_model, upper = full_model),
                      trace = TRUE )
Start:  AIC=12057.96
Glucose ~ BMI_cat

                 Df Sum of Sq     RSS   AIC
+ age_Chol_Ratio  1   12850.5 1313066 12042
+ Chol_Ratio      1   11400.3 1314516 12044
+ log_CRP         1    9889.8 1316027 12046
+ RACE            4   13786.6 1312130 12047
+ Exercise        1    7748.5 1318168 12049
+ Smoker          1    2979.1 1322937 12056
+ bp_category     3    5457.4 1320459 12056
+ Age             1    1749.5 1324167 12058
<none>                        1325917 12058

Step:  AIC=12042.15
Glucose ~ BMI_cat + age_Chol_Ratio

              Df Sum of Sq     RSS   AIC
+ RACE         4   13847.0 1299219 12031
+ log_CRP      1    8626.2 1304440 12032
+ Exercise     1    6487.2 1306579 12035
+ bp_category  3    4870.4 1308196 12041
+ Smoker       1    1719.4 1311347 12042
<none>                     1313066 12042
+ Chol_Ratio   1     418.7 1312647 12044
+ Age          1     408.6 1312657 12044

Step:  AIC=12030.76
Glucose ~ BMI_cat + age_Chol_Ratio + RACE

              Df Sum of Sq     RSS   AIC
+ log_CRP      1   12546.6 1286672 12015
+ Exercise     1    6180.5 1293039 12024
+ Smoker       1    2469.4 1296750 12029
+ bp_category  3    4363.9 1294855 12031
<none>                     1299219 12031
+ Chol_Ratio   1     290.6 1298928 12032
+ Age          1     287.2 1298932 12032

Step:  AIC=12015.01
Glucose ~ BMI_cat + age_Chol_Ratio + RACE + log_CRP

              Df Sum of Sq     RSS   AIC
+ Exercise     1    4998.5 1281674 12010
+ Smoker       1    1887.3 1284785 12014
<none>                     1286672 12015
+ bp_category  3    4026.2 1282646 12015
+ Chol_Ratio   1     254.4 1286418 12017
+ Age          1     202.8 1286470 12017

Step:  AIC=12009.89
Glucose ~ BMI_cat + age_Chol_Ratio + RACE + log_CRP + Exercise

              Df Sum of Sq     RSS   AIC
<none>                     1281674 12010
+ bp_category  3    3838.1 1277836 12010
+ Smoker       1    1014.3 1280660 12010
+ Chol_Ratio   1     259.6 1281414 12012
+ Age          1     193.0 1281481 12012
summary(step.model)
Call:
lm(formula = Glucose ~ BMI_cat + age_Chol_Ratio + RACE + log_CRP +
    Exercise, data = analysis_swan_df)

Residuals:
   Min     1Q Median     3Q    Max
-45.35 -10.27  -3.82   3.29 534.99

Coefficients:
                    Estimate Std. Error t value Pr(>|t|)
(Intercept)         79.74756    2.97072  26.845  < 2e-16 ***
BMI_catUnderweight  -2.25454    5.06702  -0.445 0.656413
BMI_catPre-obese     3.33534    1.71890   1.940 0.052487 .
BMI_catObesity I     9.14490    2.15075   4.252 2.23e-05 ***
BMI_catObesity II   10.51505    2.61561   4.020 6.06e-05 ***
BMI_catObesity III  16.29875    2.91740   5.587 2.66e-08 ***
age_Chol_Ratio       0.05500    0.01442   3.815 0.000141 ***
RACEChinese          6.30073    2.49851   2.522 0.011761 *
RACEJapanese         6.83868    2.40182   2.847 0.004459 **
RACECaucasian       -1.13207    1.55633  -0.727 0.467077
RACEHispanic       -13.49741    7.05809  -1.912 0.055991 .
log_CRP              2.42391    0.60405   4.013 6.24e-05 ***
ExerciseYes         -3.84610    1.44521  -2.661 0.007853 **
---
Signif. codes:  0 '***' 0.001 '**' 0.01 '*' 0.05 '.' 0.1 ' ' 1

Residual standard error: 26.57 on 1816 degrees of freedom
Multiple R-squared:  0.09447,	Adjusted R-squared:  0.08849
F-statistic: 15.79 on 12 and 1816 DF,  p-value: < 2.2e-16
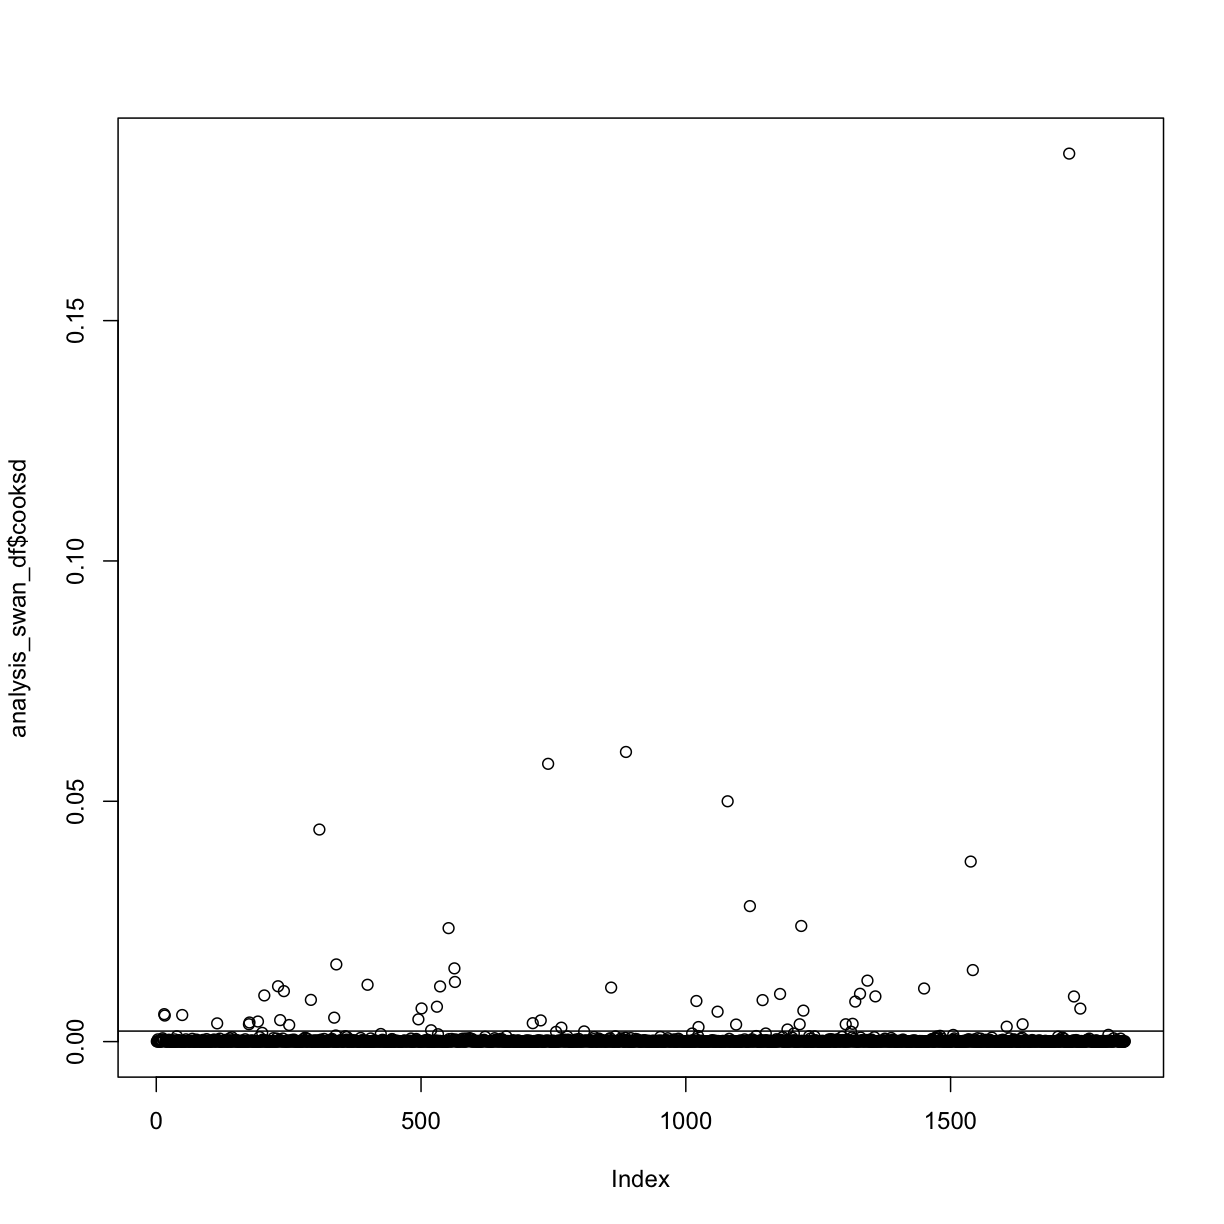
analysis_swan_df$cooksd <- cooks.distance(step.model)
cooksd_cutoff <- 4/nrow(analysis_swan_df)

plot(analysis_swan_df$cooksd)
abline(cooksd_cutoff, 0)
Dropping outliers
analysis_swan_df2 <- analysis_swan_df %>% filter(cooksd < cooksd_cutoff) %>% dplyr::select(-cooksd)

step.model.2  <- lm(Glucose ~ BMI_cat + bp_category + RACE + Exercise + log_CRP + age_Chol_Ratio,
                    data = analysis_swan_df2)
summary(step.model.2)
Call:
lm(formula = Glucose ~ BMI_cat + bp_category + RACE + Exercise +
    log_CRP + age_Chol_Ratio, data = analysis_swan_df2)

Residuals:
    Min      1Q  Median      3Q     Max
-39.014  -6.936  -1.152   4.693  55.639

Coefficients:
                                  Estimate Std. Error t value Pr(>|t|)
(Intercept)                      77.673079   1.287180  60.344  < 2e-16 ***
BMI_catUnderweight               -1.410095   2.158775  -0.653  0.51372
BMI_catPre-obese                  3.489866   0.713725   4.890 1.10e-06 ***
BMI_catObesity I                  6.216838   0.901519   6.896 7.44e-12 ***
BMI_catObesity II                 7.497746   1.106722   6.775 1.70e-11 ***
BMI_catObesity III               12.564540   1.248093  10.067  < 2e-16 ***
bp_categoryElevated               0.161504   0.833503   0.194  0.84638
bp_categoryHypertension Stage 1   1.561336   0.702918   2.221  0.02646 *
bp_categoryHypertension Stage 2+  2.811427   0.867147   3.242  0.00121 **
RACEChinese                       5.243360   1.056478   4.963 7.61e-07 ***
RACEJapanese                      6.876469   1.005095   6.842 1.08e-11 ***
RACECaucasian                    -0.388071   0.674323  -0.575  0.56503
RACEHispanic                     -7.473690   3.227633  -2.316  0.02070 *
ExerciseYes                      -0.198000   0.606417  -0.327  0.74408
log_CRP                           1.010272   0.251768   4.013 6.25e-05 ***
age_Chol_Ratio                    0.034869   0.006101   5.715 1.28e-08 ***
---
Signif. codes:  0 '***' 0.001 '**' 0.01 '*' 0.05 '.' 0.1 ' ' 1

Residual standard error: 10.9 on 1756 degrees of freedom
Multiple R-squared:  0.1925,	Adjusted R-squared:  0.1856
F-statistic: 27.91 on 15 and 1756 DF,  p-value: < 2.2e-16
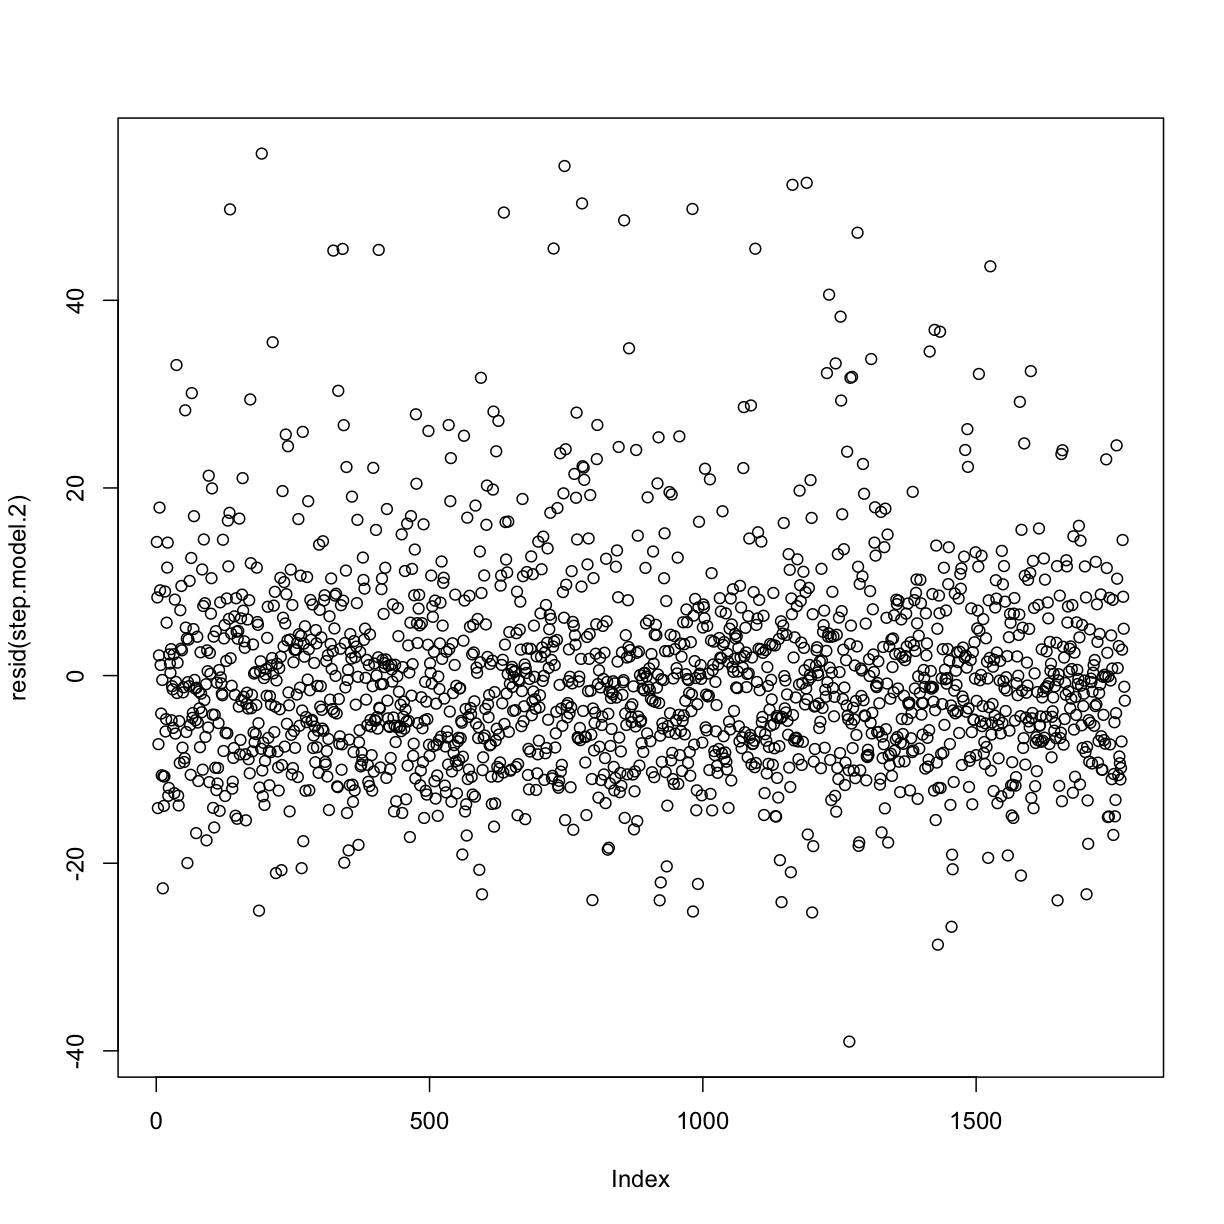
Note big increase in Adj. R-squared.
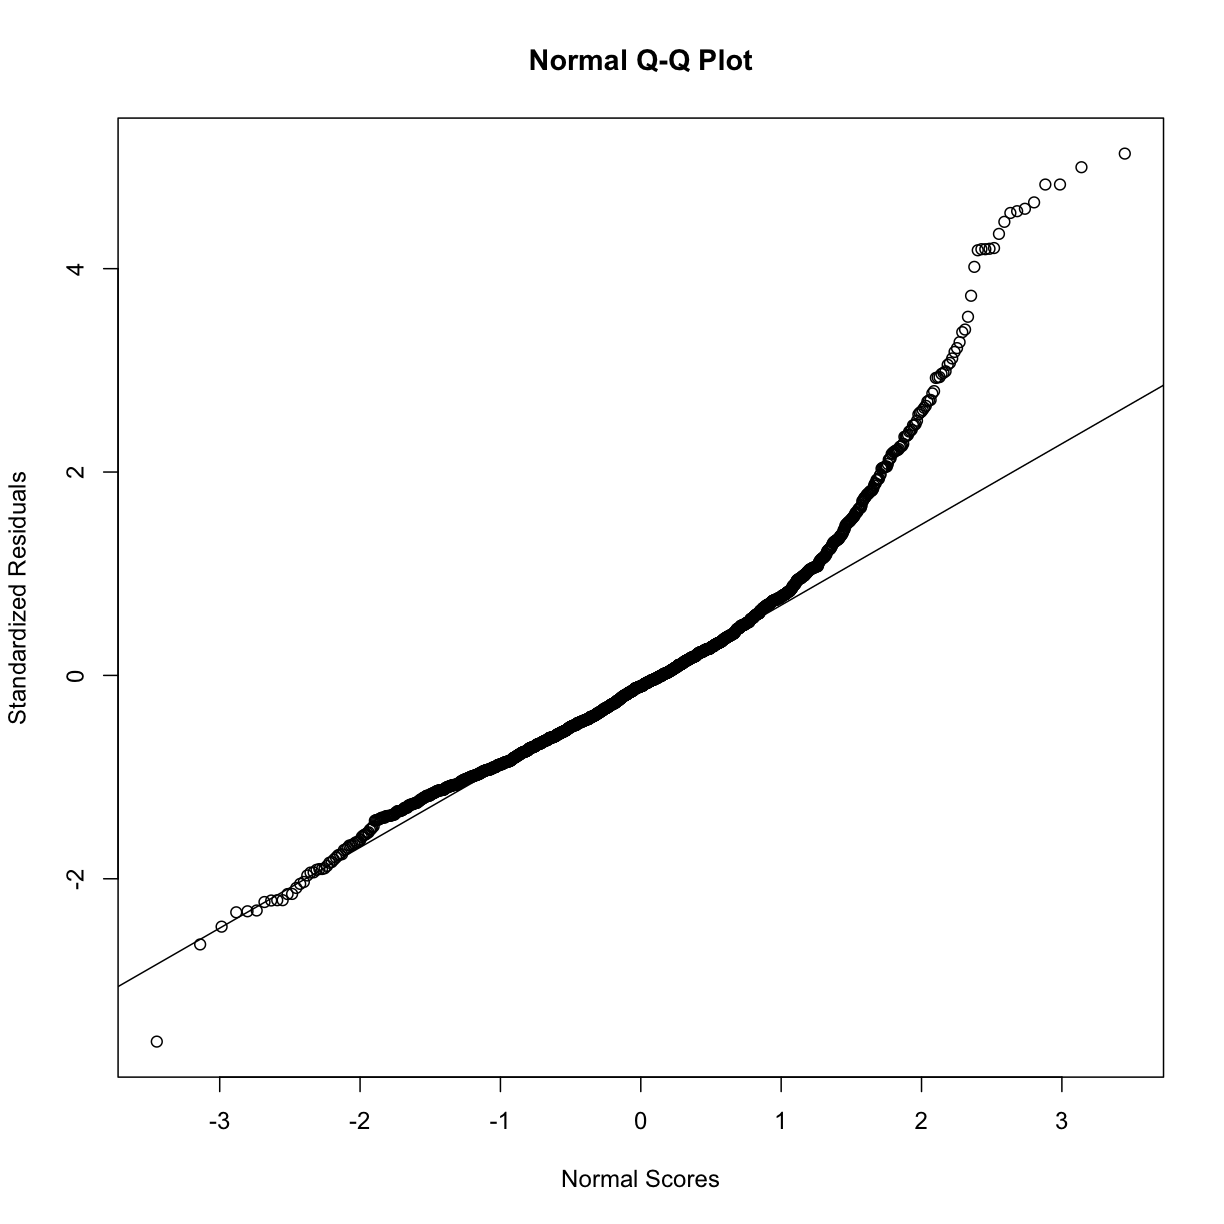
Plotting residuals
plot(resid(step.model.2))
rst <- rstandard(step.model.2)
qqnorm(rst, ylab = "Standardized Residuals",
       xlab = "Normal Scores")
qqline(rst)
analysis_swan_lt_126 <- analysis_swan_df2 %>% filter(Glucose < 126)

step.model.3  <- lm(Glucose ~ BMI_cat + bp_category + RACE + Exercise + log_CRP + age_Chol_Ratio,
                    data = analysis_swan_lt_126)
summary(step.model.3)
Call:
lm(formula = Glucose ~ BMI_cat + bp_category + RACE + Exercise +
    log_CRP + age_Chol_Ratio, data = analysis_swan_lt_126)

Residuals:
    Min      1Q  Median      3Q     Max
-36.327  -6.233  -0.968   5.053  35.647

Coefficients:
                                  Estimate Std. Error t value Pr(>|t|)
(Intercept)                      77.095409   1.110571  69.420  < 2e-16 ***
BMI_catUnderweight               -1.430694   1.847313  -0.774  0.43876
BMI_catPre-obese                  3.542659   0.612142   5.787 8.48e-09 ***
BMI_catObesity I                  5.846717   0.775352   7.541 7.51e-14 ***
BMI_catObesity II                 6.318651   0.960938   6.576 6.41e-11 ***
BMI_catObesity III                9.842746   1.098198   8.963  < 2e-16 ***
bp_categoryElevated               0.330111   0.718730   0.459  0.64608
bp_categoryHypertension Stage 1   1.068257   0.606751   1.761  0.07848 .
bp_categoryHypertension Stage 2+  2.037086   0.752063   2.709  0.00682 **
RACEChinese                       5.833614   0.906525   6.435 1.59e-10 ***
RACEJapanese                      7.368813   0.865366   8.515  < 2e-16 ***
RACECaucasian                    -0.063643   0.582807  -0.109  0.91306
RACEHispanic                     -5.377983   2.764251  -1.946  0.05187 .
ExerciseYes                      -0.119586   0.524478  -0.228  0.81967
log_CRP                           0.878406   0.216630   4.055 5.24e-05 ***
age_Chol_Ratio                    0.035128   0.005288   6.644 4.09e-11 ***
---
Signif. codes:  0 '***' 0.001 '**' 0.01 '*' 0.05 '.' 0.1 ' ' 1

Residual standard error: 9.326 on 1724 degrees of freedom
Multiple R-squared:  0.1951,	Adjusted R-squared:  0.188
F-statistic: 27.85 on 15 and 1724 DF,  p-value: < 2.2e-16
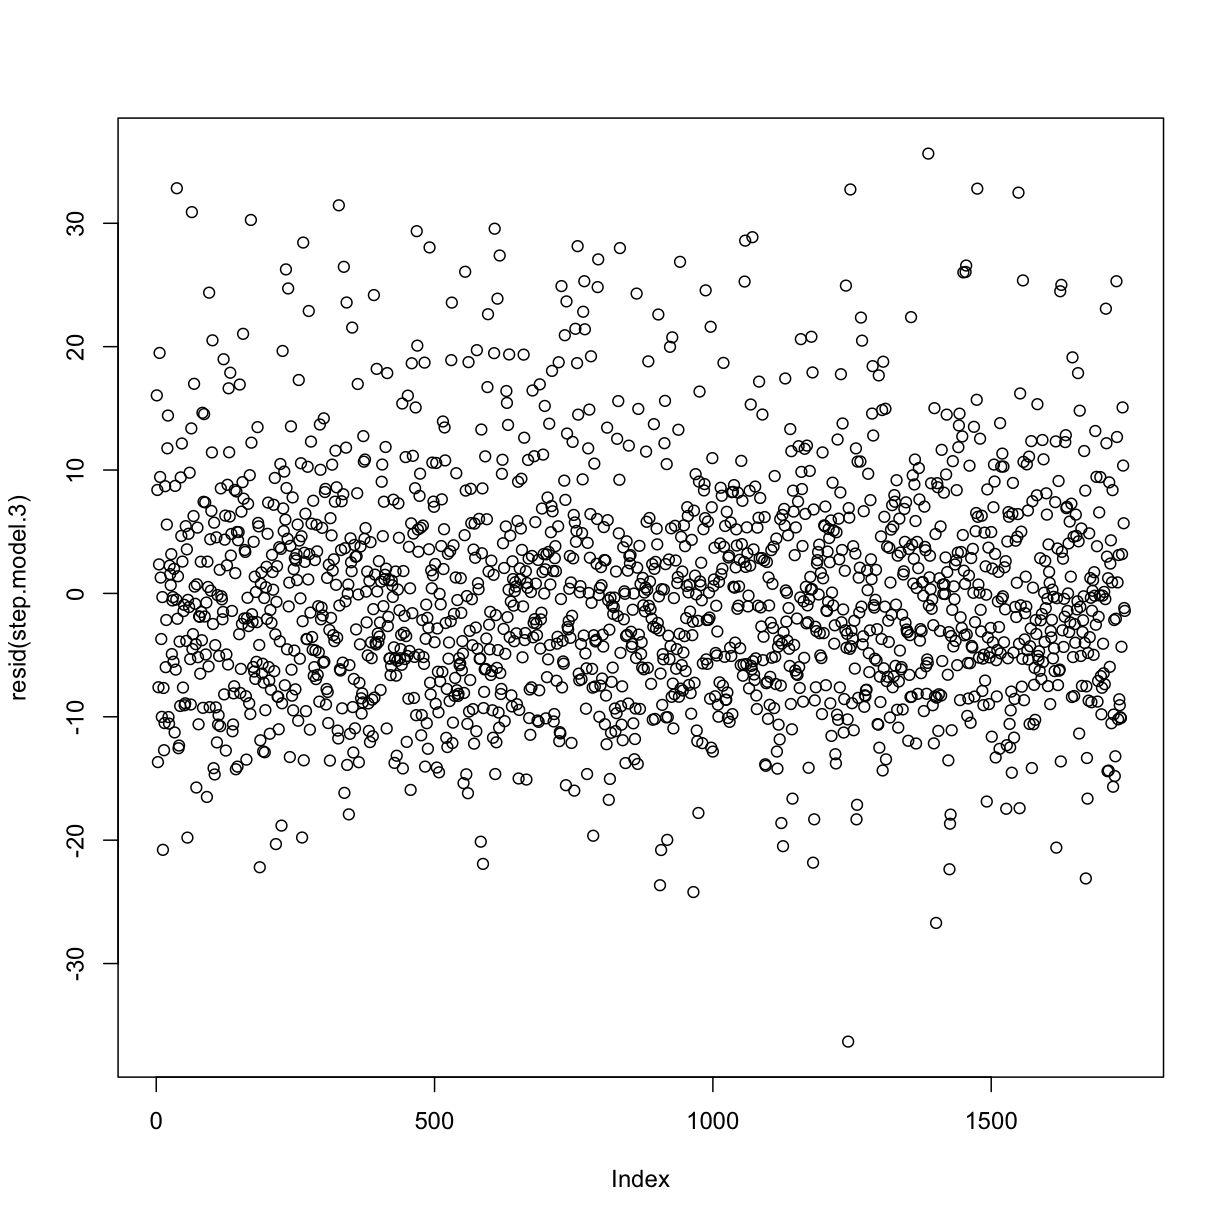
plot(resid(step.model.3))
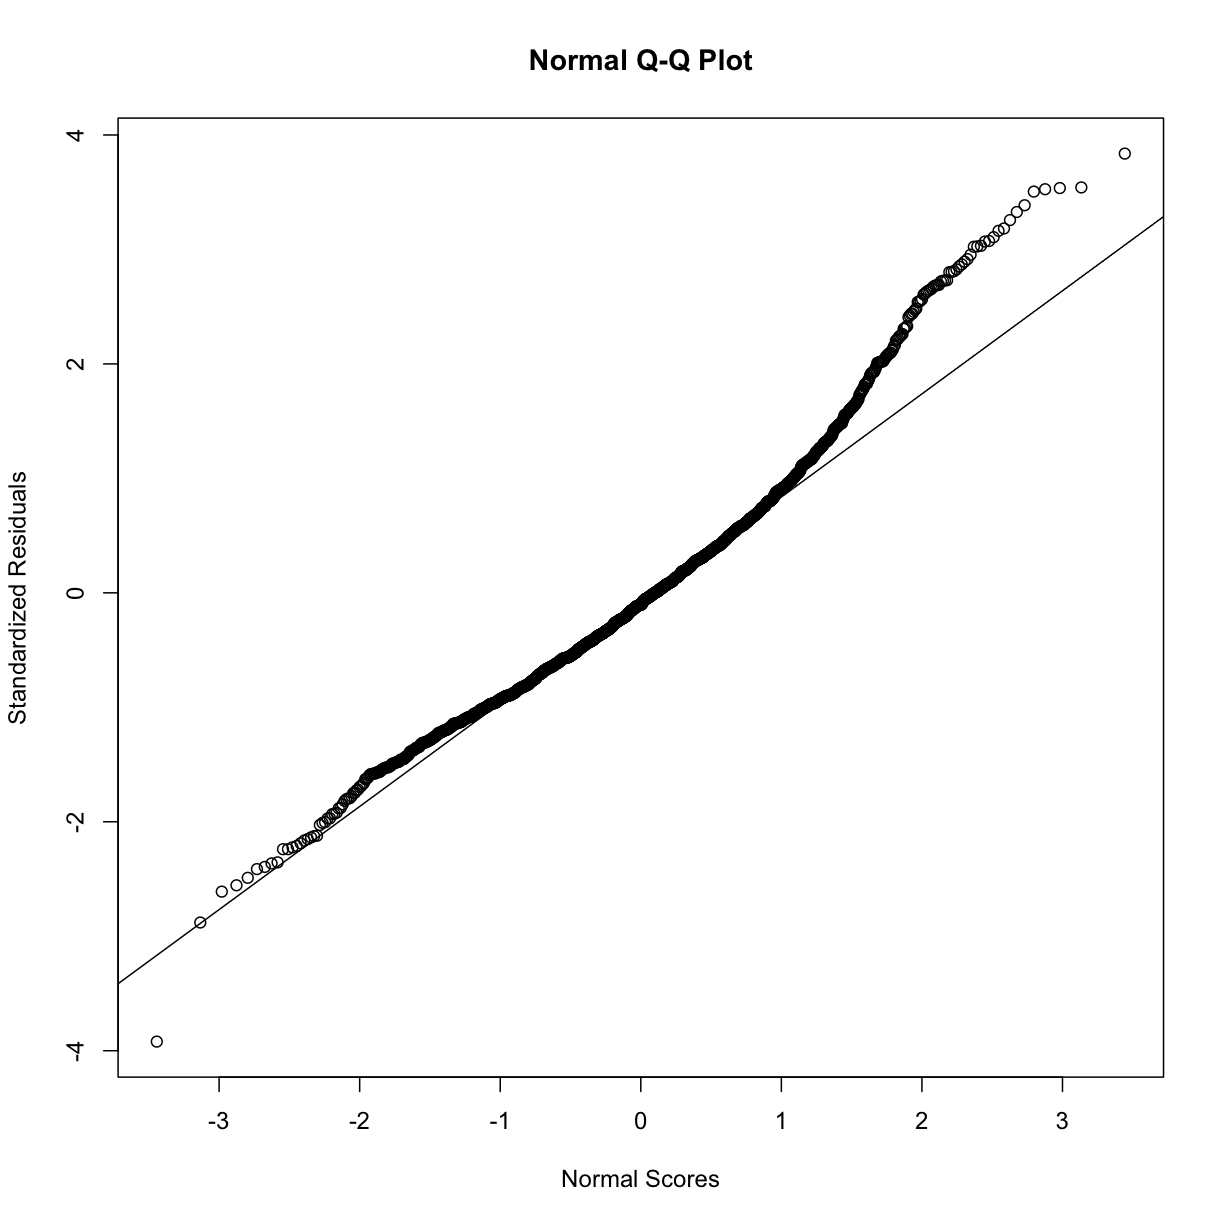
rst <- rstandard(step.model.3)
qqnorm(rst, ylab = "Standardized Residuals",
       xlab = "Normal Scores")
qqline(rst)
VIF - Collinearity
library(car)
Loading required package: carData
Attaching package: 'car'
The following object is masked from 'package:dplyr':

    recode
vif(step.model.2)
                   GVIF Df GVIF^(1/(2*Df))
BMI_cat        1.976208  5        1.070492
bp_category    1.229411  3        1.035022
RACE           1.520143  4        1.053745
Exercise       1.080253  1        1.039352
log_CRP        1.682013  1        1.296925
age_Chol_Ratio 1.116097  1        1.056455
# VIF has to be <=1 ???

#pairs(analysis_swan_df2 %>% dplyr::select(AGE6,  HDL_LDL))
vif(full_model)
                     GVIF Df GVIF^(1/(2*Df))
BMI_cat          2.044825  5        1.074152
bp_category      1.267436  3        1.040290
Age             15.237357  1        3.903506
Chol_Ratio     379.759551  1       19.487420
RACE             1.587831  4        1.059499
log_CRP          1.709259  1        1.307386
Smoker           1.106666  1        1.051982
Exercise         1.116400  1        1.056598
age_Chol_Ratio 394.428123  1       19.860215
#pairs(analysis_swan_df2 %>% dplyr::select(Age, Chol_Ratio, age_Chol_Ratio))
TODO: Durbin-Watson test for autocorrelation in residuals
library(car)
car::dwt(step.model)
 lag Autocorrelation D-W Statistic p-value
   1      0.01394421      1.971993    0.46
 Alternative hypothesis: rho != 0
Key Points
FIXME